European social model
Jean-Michel Boussemart,
Michel Godet
-

Available versions :
EN
Jean-Michel Boussemart
Michel Godet
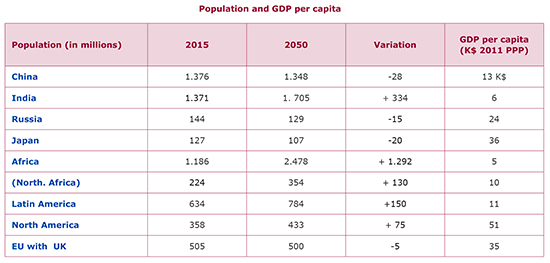
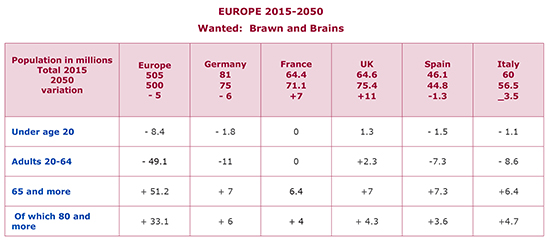
Here we are fulfilling our duty as whistle blowers, even though we will no longer be around to say (sadly) 'told you so'. Unlike North America, which should see its population rise by 75 million inhabitants (two times less than the number for South America), the Europe of 28 (EU-28) could stagnate in 2050 at approximately 500 million people while losing 49 million people of working age (20-64). That number means 11 million potentially active workers fewer in Germany and 7 to 8 million fewer in Spain and Italy. Meanwhile, France will be content to catch up with Germany, something the United Kingdom will likely achieve even earlier.
Of course it would be foolish to be pleased with this prospect given that our neighbours are also our main market: 87% of France's production is consumed within Europe; i.e., 70% for France itself and 17% through export to other European countries (56% of the 30% exported).
Demographic Tectonic Plates
Other equally compelling lessons may be drawn from this tectonic shift in demographics to take place by 2050. China, Japan, and Russia should lose 38, 20 and 15 million inhabitants respectively while India should increase by approximately 400 million people thus surpassing China by at least 300 million people. Between now and 2050, the loss will be particularly dramatic for the 20-to-64 age bracket. The figures translate to 22 million for Russia, 20 million for Japan and 195 million for China. The United States should see the number of potentially active workers rise by almost 20 million during the same period.
 Sources : Population : UN - World Population Prospects 2015 Scenario medium GDP per capita : World Economic Outlook - IMF - April 2016
 Source : UN - World Population Prospects 2015 Scenario medium
More brawn and brains will be needed to make up for the lost active labour force. What are the chances? During the same period, the population of Africa will likely increase by a total of 1 billion and 300 million —130 million in North Africa alone. In other words, the migratory pressure on Europe will be greater than ever! This will be a demographic shock —implosion (inside Europe) plus explosion (outside the EU). Yet nobody in Europe is talking about it, let alone preparing for it. Everything goes on as if this demographic tsunami were less important than the so-called digital wave.
To break this Omerta, we suggest that readers picture a few million climate refugees from Asia or more political and economic refugees arriving from Africa and the Middle East. Also, let us point out that if 1% of the increase from the African population settled in France within the next 35 years (remember 1980 is barely 35 years ago), that would equal 13 million more inhabitants by 2050; i.e., 20% more. Recalling how shaken the fragile European Union was in 2015 when a million refugees (3/4 political refugees) arrived, we realize that Europe should start preparing now for these potential situations. Europe could follow the Canadian example; i.e., a policy which does not hesitate to use quotas tied to labour market needs. At the same time, the Old Continent should encourage its population to have more children. After all, the integration process begins through sociocultural interaction in school.
Any builder knows that cement simply cannot hold when there is too much sand. If we are to receive more sand, we need more cement; i.e., more children speaking the national language, regardless of their colour. In short, to remain open to the world, we should promote fertility in Europe as of right now. Yet who is interested in family policy in a Europe that allows hotels and vacations for adults only, with pets only — no children allowed!?
The media have only just begun panicking about the fact that in 2016 the number of coffins will surpass that of cradles in Europe. Actually, this has been the case for Germany since 1971; Italy, since 1991, and Spain, as of 2016. The same may be said for Russia since 1991 and Japan since 2006. China's turn will come in 2028. The same phenomenon will hit France, even the USA, but only after 2050.
Cradles are not made from coffins. Although Europe's demographic suicide has already been announced, there is still time. After all, a good forecast is not necessarily one that takes place but rather one that leads to action avoiding it.
Grey Hair and Low Growth
[3]
Traditionally Europe's strong, post-war economic growth has been attributed to rebuilding and to catching up with the United States. Of course, this economic boom coincided with a well-known demographic one. However, we rarely hear about the increase in apparent productivity of labour during the 1950s and 1960s, a time of no computers and little talk of a technological revolution yet boasting a productivity rate two to three times higher than that of the 1980s and beyond. What else could be behind this higher productivity other than the effect of both an experience curve and a drop in unit production costs in markets experiencing continuous expansion?
Inversely, both economic growth and productivity have continued slowing down in Europe, Japan and the United States since the early 1980s.
Researchers try to uncover the causes of this concomitant slowdown in growth and productivity while information technology, biotechnology, nanotechnology and energy (new forms and storage) are more present than ever. Indeed, this is Solow's famous paradox arising from his 1987 quip about seeing the computer age everywhere but in the productivity statistics. Strangely enough, the same researchers have not asked about the possible link between this slowing down and the population's aging in old, developed zones like the United States, Japan, and Europe.
 Calculation: Coe-Rexecode using OECD Data
In Europe and in Japan, GDP growth was stronger during the 1980s than in the 1990s (2.5% versus 2.3% for Europe; 4.6% versus 1.1% for Japan). Throughout those same two decades, GDP growth in the USA remained approximately one point higher than that in Europe. Essentially the reason is demographic, given that the gap in GDP growth per capita is only 0.2 of a point higher across the Atlantic than in Europe for the same periods. In fact, demographic growth of 1% annually has existed in the US since the early 1960s; i.e., two to three times higher than the European rate [4]. Another part of the explanation for the higher GDP growth in America lies in the higher employment rate and annual number of days/hours worked. The Americans may well be advancing faster because there are more of them and they are doing more.
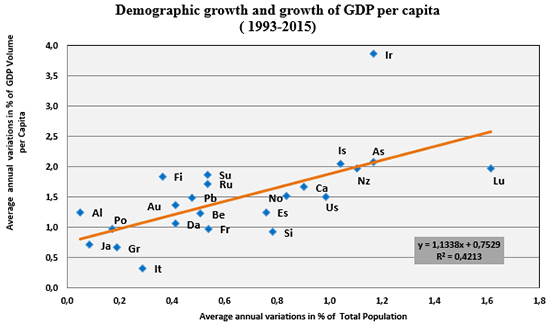
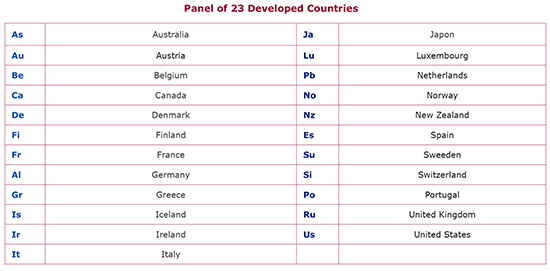
We assembled a 23-country panel of long-time OECD members: Austria; Australia Belgium; Canada; Denmark; France; Finland; Germany; Greece; Iceland; Ireland; Italy; Japan; Luxembourg; New Zealand; Norway; Portugal; Spain; Sweden; Switzerland; the Netherlands; United Kingdom, and USA. Using the Ameco data base from the European Commission, we then calculated per country for 1993-2015 the average annual variation in percentage of total population and the average annual variation in percentage of volume of GDP per capita. The cluster of 23 pairs of data obtained is statistically significant using a linear regression with an R2 of 0.42.
 (*) en % des votants

Digital Wave Hiding Demographic Tsunami?
At the Commission in Brussels, as well as in most other national and international instances, the issue of a link between demography and growth is rarely raised. Reports on technology, innovation and competitiveness abound, but humans are only studied as capital, primarily from the perspective of training, accurately considered an investment or long-term growth factor. Demography is only treated in terms of aging from above with the inherent problems arising from the pension system, healthcare expenses and senior dependent living costs. Almost never does anyone mention the consequences of aging from below; i.e., the impact of aging on both growth and the position of Europe within the world.
In 2000, the ambitious Lisbon strategy for growth and employment wagered heavily on information technology and the knowledge economy to ensure Europe a future and powerful position on the international scene (horizon 2010). Almost halfway, in 2004, the Wim Kok Report stayed the course on the knowledge society and sustainable development for an enlarged Europe but added something new, one page devoted to Europe's aging population. This demographic detail had the potential to decrease the EU's potential for growth by one point (approx. 1% instead of 2%) by 2040. Yet not a word was uttered about demographic development comparing Europe with the United States. This oversight seems all the more remarkable as intercontinental comparisons are systematically carried out regarding research efforts, innovation, and productivity assessment.
Demographic Multiplier Effects
As Alfred Sauvy put it, economists 'refuse to see' the link between economic growth and demographics so they never try to verify it. Yet the post-war economic and baby booms go together and the rise of the United States may also be explained by healthier demographics. For thirty years, the fertility rate in the USA has been approximately 2.1 children per woman versus 1.5 in the EU-15. The American population, also experiencing significant migratory flows, has continued its strong growth. The comparison between the two growth rates (US and EU) usually points to technology in explaining differences over the long term. Nevertheless, we have to wonder if there is no 'demographic multiplier' effect, too. This hypothesis enables us to understand better why growth and productivity gains between 1950 and 1960 were two times higher than during the 1980s and 1990s even though these years were marked by technological revolutions, theoretically sources of productivity gains.
With the new economy, the whole matter seemed settled. The US would undergo a period of robust economic growth with productivity increases (apparent productivity of labour) much greater that Europe's. Once again this was proof of Europe's technological disconnect in comparison with America. Or was it? We may have doubts about this explanation now that we possess statistics validated by past performance. In the 1980s, GDP growth per active member of the population was comparable (approx. 1.5%) with a slight advantage for Europe in the 1980s. Nonetheless, since the 1990s, the European situation seems to diverge from the American in which apparent productivity of labour (GDP/employed active member of the population) increased by more than 2% annually in the 1990s and 1.5% annually until 2007. The rate has been 1% since the crisis. During the same interval, the increase in productivity in the EU-15 slumped from 1.7% in the 1990s to 1% annually between 2000 and 2007 and then slipped to 0.3% as of 2008. Here is the question: should this productivity gap be attributed to the technology gap or the demographic gap? Our hypothesis: the latter plays a determining role, as the demographic gap is widening more than ever.
Of course, all the inhabitants of a country are not working, but the number of hours clocked do help explain the difference in the level of apparent productivity of labour per active member of the labour force because the Americans work 46% more than the French annually. If the Americans are working, there must be a genuine demand to satisfy, indeed, perhaps a more sustained demand due to demographic expansion.
If we discard the hypothesis that the two variables 'GDP per person' and 'demographic growth' are independent, we can advance a new hypothesis, that of a demographic multiplier driving a significant portion of the greater gains in American productivity. As a rule, economists refer to the famous Cobb-Douglas production function to explain growth through three factors: capital, work and technical progress (technology). Let's go back to those basics. The multi-factor productivity (MFP) measures the residual growth that cannot be explained by the increase of production factors (capital and labour). Given the lack of alternatives, the increase in GDP growth per active member of the labour force is thus attributed to technical progress, notably the spread of information technology. This becomes a positive way of treating an unexplained residual.
Demographic Dynamics and the Apparent Productivity of Labour
GDP growth actually depends on two factors: GDP per active employed worker and the number of active employed people in the labour force. The increase in GDP per active employed person has indeed been stronger in the US than in Europe since the mid-1990s [5].
In reality, the variance in GDP per actively employed person (apparent productivity of labour) is all the more significant as the number of actively employed and the number of job opportunities increase within an expanding population. Technology, learning and economies of scale combine to lower unit costs, enhance quality, and in short, increase the value added; i.e., the GDP per active member of the labour force. The multiplier in this demographic dynamic still functions in the US, albeit less than in the 1960s. It no longer operates in a grey-haired Europe. Economists cannot find this demographic multiplier because they are simply not looking for it. Yet this hypothesis would go beyond just the lag in information and communication technology to shed more light on the widening gap in GDP growth per active worker between the US and Europe, witnessed since the start of the new millennium. In short, long-term growth in developed countries is driven by demography. Without human capital, growth remains stunted.
With the current fertility indicator at approximately 1.5, tomorrow's Europe will have one-third fewer young active members of the labour force than today. A dip in the birth-rate for a country is like a decrease in investment for a corporation. In both cases, the bottom line looks fine for a while but at the expense of serious problems in the future. Accordingly, a government family policy that supports demographic growth is a long-term investment. Some may argue that the birth deficit in Europe and its negative impact on future economic growth and the raising of the standard of living could be compensated by ever larger migratory flows. They are kidding themselves, as highlighted by recent events, notably the UK's vote to leave the EU (Brexit), and by the reactions of almost all European nations to recent fluctuations in the number of migrants arriving from Africa and the Middle-East.
***
European countries look like orchards whose trees were fruitful for 40 years then reached maturity without any seedlings planted. Yet, if we are to invest and consume, we must have confidence in the future and the need to purchase basic goods. Unfortunately, these two characteristics decrease with age. Deep down, a dynamic society relies upon the same fundamentals as economics and demographics. In other words, the desire to live is expressed through economic initiatives and raising children. Somehow, the entrepreneurial spirit remains closely linked to the family spirit.
[1] This text was originally printed in 'Schuman Report on Europe, the state of the Union 2017, Editions Lignes de Reperes, March 2017
[2] According to Eurostat the EU population is estimated at 511.8 million on 1st January 2017 http://ec.europa.eu/eurostat/documents/2995521/8102195/3-10072017-AP-EN.pdf/a61ce1ca-1efd-41df-86a2-bb495daabdab
[3] The IMF has in January 2018 estimated global growth at 3.7% in 2017 and growth for 2018 and 2019 have been revised upward http://www.imf.org/en/Publications/WEO/Issues/2018/01/11/world-economic-outlook-update-january-2018
[4] Since 2 years, EU growth is higher than US growth http://money.cnn.com/2018/01/30/news/economy/gdp-europe-economy-2017/index.html
[5] See Eurostat http://ec.europa.eu/eurostat/documents/2995521/8627394/2-30012018-AP-EN.pdf/0374d17b-ba86-4aab-8837-c4865e087ceb
Publishing Director : Pascale Joannin
On the same theme
To go further
Freedom, security and justice
Jean Mafart
—
15 April 2025
Asia and the Indo-Pacific
Pierrick Bouffaron
—
8 April 2025
Democracy and citizenship
Radovan Gura
—
25 March 2025
Strategy, Security and Defence
Stéphane Beemelmans
—
18 March 2025

The Letter
Schuman
European news of the week
Unique in its genre, with its 200,000 subscribers and its editions in 6 languages (French, English, German, Spanish, Polish and Ukrainian), it has brought to you, for 15 years, a summary of European news, more needed now than ever
Versions :


